
At Greyfox we believe in keeping you informed about what is going on in the property market.
Posted on: Thursday, May 4, 2017

But what are these figures based on? The latest data from the Land Registry House Price Index helps to show the makeup of the region’s housing markets. While there is no single measure which provides a complete picture of the market, below are 12 areas with statistics on the total value of all property transactions in the past year. This has been calculated by multiplying the average value of homes by the number of sales.
This week, we look at the North East of England.
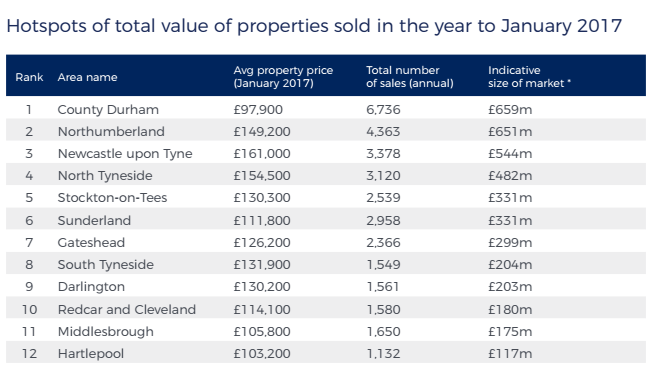
* Average price in the year to January 2017 multiplied by the total number of transactions in the same period.
Market snapshot:
Where have house prices increased the most?
Here are five districts with the highest annual capital growth.
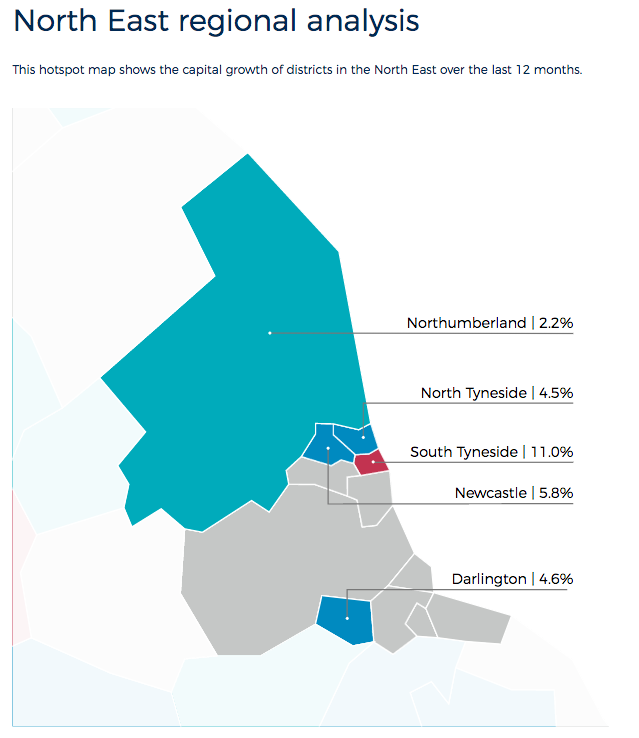
“The North East property market is a collection of micro-markets, each with their own particular drivers and nuances. Some markets have higher levels of turnover than others and indeed some perform better than others when it comes to capital inflation,” said Iain McKenzie, CEO of the Guild of Property Professionals.
Why is the interest rate so important for the property market and homeowners? The fact is that...
Read More
As Her Majesty The Queen celebrates her unprecedented 70 years on the throne with her Platinum...
Read More
There is no doubt that Brexit has already had an impact on the property market with many...
Read More